Understanding economic cycles: An introduction
(Since April is Financial Literacy Month, a number of articles will be devoted to more educational topics. This is Part I in a four-part series about how understanding economic cycles could inform your financial decisions. Part II is Recognizing economic seasons: recovery and growth. Part III is The fall and winter seasons of the economic cycle. Part IV is How to profit from economic cycles.)
Getting rich slowly is built on these four commonly understood pillars:
- Get out of debt (and stay out of debt)
- Find ways to earn more
- Spend less than you earn
- Invest the difference
Despite the fact that many people followed those four guiding principles during the Great Recession, some “got poor quickly” instead. I believe that is because there is something else to know about the economy and how it affects our finances. This post is the first in a short series explaining what I understand about the economy and its seasons.
I believe that, if you grasp the concepts presented here, it can help you avoid some of the financial hardships recessions bring. More than that, though, it is also possible to benefit from opportunities you may not have recognized in the past. For example, my family’s net worth tripled in the Great Recession using the understanding of the four seasons of the economy, despite some setbacks and other opportunities I missed out on. These concepts don’t replace any of the four pillars mentioned above; they simply open our eyes to see opportunities we may have missed before.
Measuring the Economy
The economy includes all transactions where money changes hands. When parents give kids an allowance, that event is as much a part of the economy as Apple’s selling 70 million iPhones or your buying a half soy, half caf, half Stevia, double shot at your local, overpriced coffee shop. Although it is impossible to measure each and every one of those billions of transactions a day, the government boffins holed up in their windowless rooms at some hidden location do manage to come up with an estimate which they call the Gross Domestic Product, or GDP.
The Federal Reserve Board, or Fed, uses the GDP as their benchmark of the economy. More particularly, they look at the growth of the GDP each quarter.
The Fed’s technical definition of a recession is two consecutive quarters of negative GDP growth, but it is hard for us to relate to something as abstract as the GDP. But we can easily understand having a job, so the unemployment rate is a better measure of the economy for most of us. After all, what is a country if not its people? If those people are working, the economy is good; but if they are not working, it is decidedly not good.
Fortunately, most measures of the economy coincide. When unemployment is at its highest, the GDP is at its cyclical low point, so it doesn’t really matter which measure you use.
Our Economic Track Record — Growth Over Time
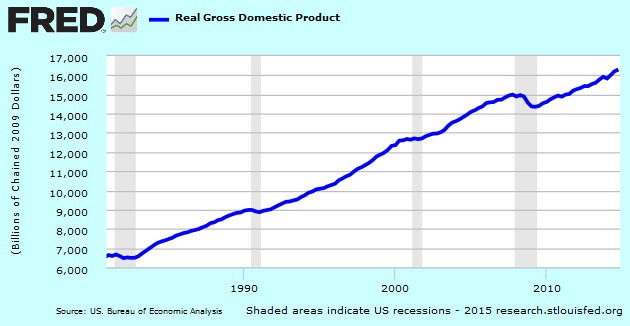
Looking at America’s economy over the past hundred years or more, the number one take-away is its growth. When the economy dips (or goes into a recession) it may feel devastating; but if you look at the big picture, you can see why most people view the American economy as one of the best in the world. Over time, it just keeps growing, as shown in the chart below.

- U.S. GDP 1981 – present
You can see how, despite two severe and two minor recessions in the past 30-odd years, the U.S. GDP has more than doubled after adjusting for inflation. (That is what the “Real” in the chart’s title means.)
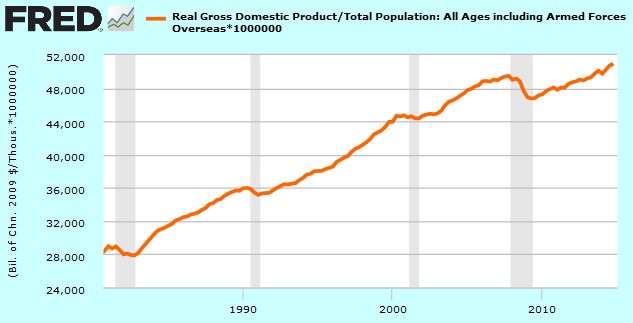
Some part of that is due to population growth: After all, the more people we have giving allowances and buying smartphones, the bigger the GDP. When you track GDP per capita, though, you see almost the same thing. (The following chart uses the data from the previous chart simply divided by the population.)

- U.S. GDP per capita 1981 – present
In other words, over time, the U.S. economy is growing — and your income and net worth can be expected to grow too. Still, you can clearly see four dips in the GDP which occurred in the four recessions since 1981. Recessions (those areas where the blue — or orange — line dips in the gray bars) occur regularly. They are part of what we call the economic cycle.
Understanding the Economic Cycle
Most of us have heard that the economy goes up and down. Everyone likes the up part — that’s when the economy is doing well and nobody pays attention to it. However, what many do not realize is that the economy drops every seven to 10 years, almost like clockwork.
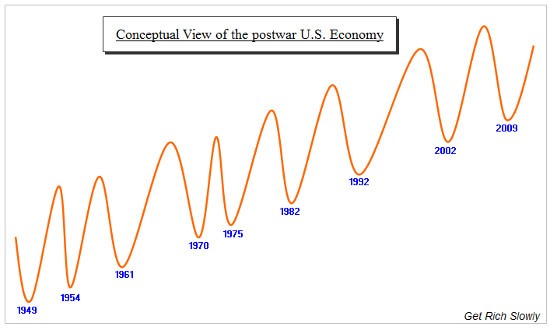
For now, why the economy tanks every seven to 10 years doesn’t concern us — our focus is to arrive at a strategy that will keep us getting rich slowly even when the economy does slip into recession. If we simply think of ups and downs, the economy would have looked something like this since World War II:

The only things to note in this chart are the dates which represent the official dates when each recession bottomed out. The rest of the chart is a simple schematic, exaggerated for effect.
The first purpose of the chart is to help you visualize the up-and-down movement of the U.S. economy. The second is to give you an idea of how short these cycles have been. Historically, 10 years is the longest that it has taken from one bottom to the next — but frequently that interval was much shorter. Seven to 10 years is the range I use when I look at the economy, trying to build an expectation of what lies ahead.
Seven to 10 years may be a good starting point in gauging the duration of a single cycle, but it is not quite as helpful as another number I track: time to downturn. That is how long it takes from a recession bottom to the point where the economy starts turning down. That’s a little fuzzier to figure out. And I’m not going to try to represent that this is the ultimate in accuracy; but the way I look at the economy, it takes between four and eight years from a prior bottom to the next downturn. (Some recessions have a quick drop to the bottom while others labor a little longer to get there.)
In other words, if historic trends hold (as they have for a long time), we can expect a downturn between four and eight years after a prior bottom. (And if you are doing the math on the current cycle, you probably recognize that we are already inside the window for the next downturn.)
Visualizing the Four Seasons of the Economic Cycle
So far, this may be interesting only in a purely academic kind of way because it doesn’t tell you what you can do about all of this. To figure out a strategy to protect our finances (or even hopefully to profit financially), it helps to consider another concept: the seasons of the economic cycle.

When you look at a single cycle, bottom to bottom, it is possible to identify four distinct seasons that correspond roughly to the four seasons of a year:
- the winter of recession,
- the spring of the early recovery,
- the summer of growth,
- and a harvest season
Winter, spring and summer make intuitive sense. The fall/harvest season, though, is the one which presents the most problems. We’ll get to that later in the series; but first, there are a few important things to note.
Duration: Each season lasts exactly three months in nature, but that isn’t the case for economic seasons. Each economic season can last years.
In fact, economic seasons are not all the same length. Most of the time, each one will last longer than a calendar year, but it is impossible to predict how much longer.
Imperceptibility: In nature, it is hard to tell exactly when a season changes without a calendar and an army of meteorologists telling us that spring sprung on March 21 at 4:45 p.m. Most years, the 21st of March feels pretty much like the 20th of March. In fact, a week in April may have a lower average temperature than a week in March. The fact that we are unable to perceive a change in the natural seasons doesn’t mean the change isn’t happening. We know in time the new season will make itself evident.
It’s the same with the seasons in the economy: The transition from one season to the next is fuzzy and unclear. However, when you look back, you can usually see things have changed.
Sequence: To me, the most important thing about the four seasons is that the sequence never changes. Spring always follows winter, and fall always follows summer. Therefore, once we are able to identify which season we are in, we have a good idea of what is coming next. That may sound simple and obvious, but you would be surprised how many people don’t think of it like that. (More of that in the following installments of the series.)
This — the fact that we can predict which season will follow the one we are in — holds the key to our being able to:
- protect our finances from the hurts that recessions can bring, and …
- benefit from opportunities many overlook.
In the next part of the series, I will attempt to explain how understanding economic seasons can help you plan your finances in the same way farmers use the seasons of nature to earn a living.
How many recessions have you experienced? What did you learn about how to weather an economic downturn?
Become A Money Boss And Join 15,000 Others
Subscribe to the GRS Insider (FREE) and we’ll give you a copy of the Money Boss Manifesto (also FREE)
